ThingsBoard is good software, and if your job is watching a fleet of devices right now — alarms firing, valves closing, a wall of live dashboards — you could do a lot worse. The trouble starts when an environmental team adopts it believing that watching devices and defending measurements are the same job. They aren't, and the difference is exactly where monitoring programs get hurt.
This post is part of our comparison series, and the rule of the series holds: credit first, contrast second, and say plainly where the other side wins.
What ThingsBoard is genuinely great at
Three things, and they're not small. First, device management: provisioning, credentials, firmware-update campaigns, fleet organization, this is the operational care and feeding of thousands of physical devices. Second, protocol ingestion: MQTT, CoAP, HTTP, LwM2M, with a gateway for the industrial protocols behind them. If your hardware speaks it, ThingsBoard listens. Third, real-time visibility: telemetry lands on a live dashboard in seconds, and a rule engine turns it into alarms and actions. It's open source at its core, widely deployed, and priced accessibly. List pricing for a managed instance runs in the low hundreds per month.
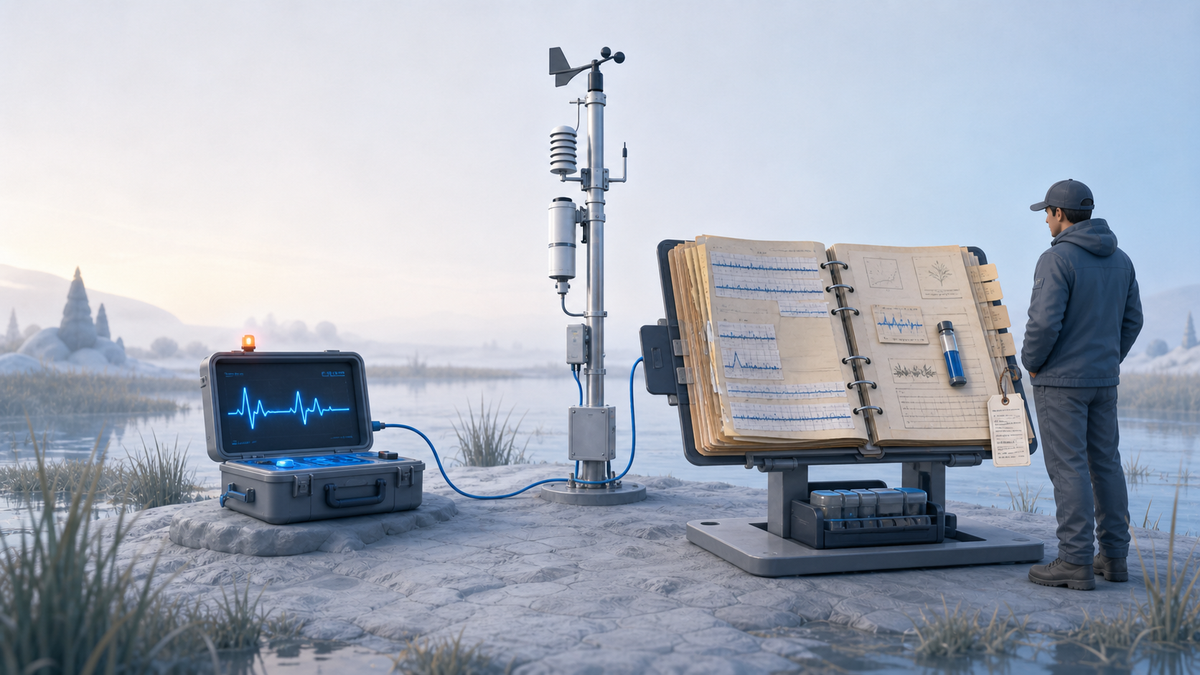
That's a real product doing a real job. Here's the analogy I'd use for what that job is: ThingsBoard is the bedside monitor in a hospital room. It shows the heartbeat now, it alarms when a line goes flat, and no hospital should run without one.
But nobody makes a treatment decision from the monitor's afterimage. Decisions come from the chart; the longitudinal record with the lab results, the annotations, the history of what was done and when, assembled so that another doctor can pick it up cold and trust it. Science runs on charts, not monitors. A regulator asking "how was this number derived" is asking for the chart.
Where the science job starts and the dashboard stops
Three specific capabilities separate a monitoring console from an analysis platform, and they're the three we built Datasparks around.
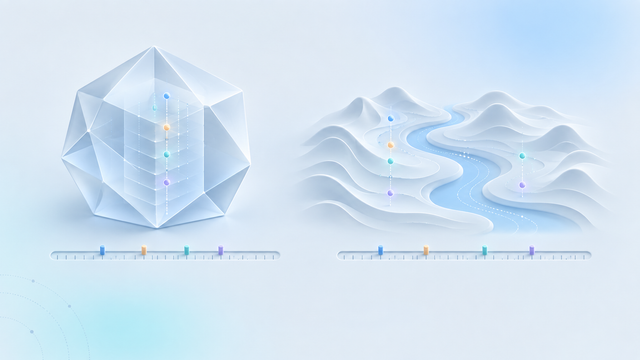
Quality time harmonization. To compare instruments that report on different clocks, you have to align them to a common timeline. The moment you do, you face the question of what belongs in the intervals where a sensor was offline, how upsampling or downsampling should really function for the type of data, and how to know you've pushed resampling too far. ThingsBoard's aggregation features answer it the way IoT tooling generally does: aggregate what's there. There's no concept of a gap as a first-class thing to preserve and reason about. In Datasparks, raw data always keeps an untouched observed series, and every harmonized variant carries an explicit gap tolerance and aggregation fidelity loss statistics. We think gaps are data too, and that conviction has to live in the data model, not in analyst discipline.
Quality rules with provenance. ThingsBoard's rule engine is built for reacting. A threshold crossed fires an alarm or a webhook, now. Scientific quality control is a different verb: write the validation logic once as a named ruleset, apply it across datasets, score and flag rather than merely alert, and record which rules ran on which data. In Datasparks that execution record is written once per pipeline run and can't be edited afterwards, because "which rules produced this flag" is a question you'll be asked years later, under scrutiny. It's the chart nobody can quietly amend after the fact and that permanence, not the dashboard, is what makes a number defensible.
Curated data products. An ops console's output is a screen. A monitoring program's output is a deliverable: a governed, versioned dataset with freshness tracking that a client, agency, or research partner consumes with confidence. ThingsBoard has dashboards you can share; it has no concept of the dataset-as-product. In practice teams export CSVs and re-enter the spreadsheet-email workflow the platform was supposed to end.
There's a fourth difference worth naming because almost nobody checks it: the device registry. ThingsBoard maintains a useful entity model of your devices and their relationships, but it's a current-state registry with a generic audit log behind it. It tells you what the fleet looks like now. It doesn't make the history of deployments, like this instrument was at that site from January to March, then swapped, a time-versioned record that data attribution consults. We treat deploy, swap, and move as first-class dated events, and the ingestion pipeline resolves every incoming reading against that history. Why that matters gets its own post.
The operating bill nobody demos
One more contrast, and it's economic rather than architectural. ThingsBoard's headline attraction is a low sticker. Self-host the open-source core for the cost of a server, or pay list price for the managed edition. Self-hosting is a real option and plenty of teams take it, but be clear-eyed about what "free" buys: you now operate a database, a message queue, upgrades, backups, and security patching for an internet-facing system that your devices depend on. That's a competent sysadmin's part-time job before anyone has analyzed a single reading. But somebody provisions devices, maintains the instance, writes and re-writes the rule chains, and builds every piece of the science layer above by hand. In our cost model for a mid-size network, (about a dozen sensors, labor at loaded rates, method published in the TCO post) a ~$150/month ThingsBoard path lands around $1,100/month all-in, with roughly six of every seven dollars being your team's time. Those are our estimates, stated so you can rerun them with your own numbers; the pattern is the point. The platform is inexpensive. Operating it as a science platform is not, because it wasn't built to be one.
Where ThingsBoard wins, and stays won
Now the boundary, stated as a recommendation rather than a footnote. If your requirement is real-time operations (you need to command devices, alarm within seconds, and manage firmware across a fleet) ThingsBoard is built for that and Datasparks is not. We are not built to be an ops console. We don't do device control, and an alert about your data quality is not a SCADA alarm. Teams whose center of gravity is operational IoT should score ThingsBoard high on exactly the dimensions where it earns it, device lifecycle, protocol coverage, real-time responsiveness.
The two can also simply coexist: ThingsBoard (or any capable IoT layer) as the real-time front end, Datasparks as the system of record where measurements get harmonized, quality-controlled, and turned into defensible deliverables. The bedside monitor and the chart aren't competitors. They're different instruments for different moments of care.
The question to take away
If you're evaluating ThingsBoard for environmental work, one question sorts it fastest, and it's worth asking in the demo, out loud, while everyone's watching the dashboards update: when this data leaves here for a client or a regulator, what does it travel as? If the honest answer is "a CSV export and a prayer," you've found the boundary of the tool, not a flaw in it, just the edge of the job it was built for. Our 12-point rubric has eleven more questions like it, and we think you should ask every vendor all twelve, us included.