
Somewhere in your organization there is a $25-a-month data stack that is quietly one of your largest line items. It doesn't look like one, because the part that costs money never appears on an invoice. It appears on your calendar. This post is the arithmetic behind that sentence, laid out so you can rerun it with your own numbers and tell me where I'm wrong.
I mean the invitation literally. Every figure below is an estimate with a stated assumption. Estimates you can argue with are worth infinitely more than confident numbers you can't check.
The shadow payroll
Here's the framing that made this click for me. In accounting, everything a company pays people shows up in payroll. That's what makes labor costs governable. But a DIY data stack runs on what I've come to call a shadow payroll: hours of skilled work, billed to nobody, approved by nobody, invisible in every budget review. The tooling invoice gets scrutinized annually. The forty-five minutes your hydrologist spent this morning re-mapping a logger export got scrutinized by no one, and it will happen again next week.
Budgets govern what they can see. The whole trick of the $25 stack is that its real costs are structurally invisible to the process that's supposed to catch them.
Walking one month, line by line
Take a concrete shape: a mid-size monitoring network, about a dozen sensors across a few sites, two or three instrument vendors, data arriving weekly as files and API pulls. A working scientist runs the stack using Excel, some Python, and a BI tool. Now walk a typical month:
- Export wrangling: ~6 hours. Downloading vendor exports, re-mapping the columns that moved, fixing the timestamp format that changed with the firmware, chasing the file someone renamed, copying files into the defined folder structure.
- Pipeline care and feeding: ~5 hours. The resampling script, its Python environment, the machine it runs on, and the run that failed silently on the 14th.
- Quality checking by hand: ~6 hours. Eyeballing charts for spikes, cross-checking suspect values against field logs, deciding again, with no record of last time's decision, what counts as valid.
- Rebuilding outputs: ~4 hours. The dashboard that broke when a column was renamed; the monthly summary re-assembled by copy-paste.
- Answering "why does March look weird?": ~5 hours. The archaeology tax: reconstructing what a number means, months later, from scripts and memory.
That's about 26 hours. Now the rate, with its assembly shown: salary data puts an environmental scientist around $42 an hour in base pay; load that by roughly 40% for benefits and overhead — the number your organization actually pays — and you get about $59 an hour. So the month costs about $1,534 in labor. Add the $25 of tooling and the "cheap" stack runs about $1,559 a month. Sixty-two times its sticker price.
Your hours will differ; that's the point of showing the lines. Halve every one of my estimates and you're still at about $790 a month, which is over thirty times the sticker price. The conclusion survives aggressive discounting, which is what makes it a conclusion rather than a talking point.
Every path has a labor line
The same arithmetic applies to every option on the market, which is where it gets interesting. Price the tooling and the time, and the market re-sorts itself.
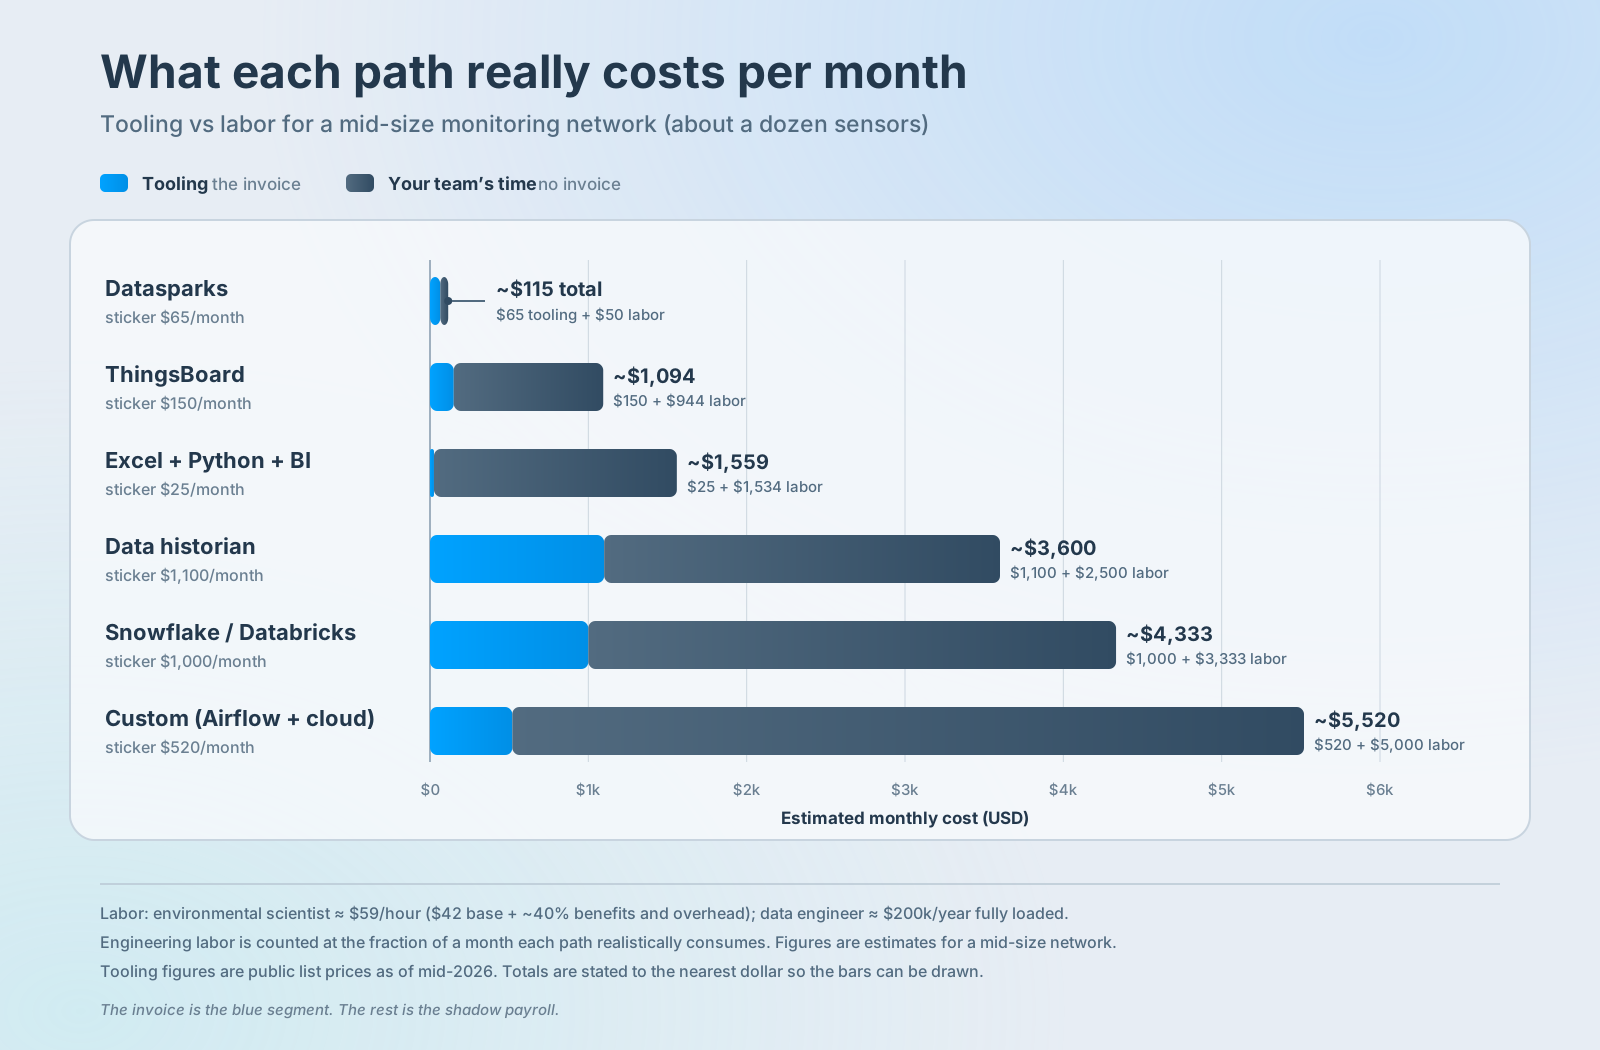
The rates behind the bars: the environmental scientist at the $59/hour loaded rate assembled above, and for the paths that need one, a data engineer at about $200,000 a year fully loaded, or roughly $16,700 a month, of which each path consumes some fraction. Tooling is public list pricing as of mid-2026. Every bar is an estimate built the same way, so the comparison is at least consistently wrong if it's wrong.
Two things in that chart deserve a slow look. First, the DIY stack has the lowest invoice on the chart and the third-highest true cost — the entire difference is the shadow payroll. Second, the expensive platforms don't escape the problem; they relocate it. A warehouse or a custom pipeline swaps the scientist's hours for a data engineer's, a fraction of one is the biggest line in the bar. The invoice goes up and the labor stays.
And yes, our own bar has a labor segment too. Datasparks on this network runs about $65 a month on our public meter plus about fifty minutes of your team's time, call it $115 all-in. I don't claim zero-effort; nobody should. I claim the honest version: the platform's job is to move work off the shadow payroll and onto features. The mappings configured once, quality-rule runs recorded permanently, deliverables that version themselves. What's left of the labor line is the part only a scientist can do.
The honest objection
Let me argue against myself for a minute, because there's a real counterpoint: some of those hours are not waste. A scientist eyeballing a chart for spikes is doing quality control; deciding what counts as a valid reading is scientific judgment; a portion of the "why does March look weird" archaeology is genuine analysis. Both fair and worth pricing, so let's price it. Strip the walk down to only the purely mechanical lines: the export wrangling, the pipeline care, the rebuild-after-rename and you're left with 15 hours, about $885 a month, still roughly thirty-six times the sticker with the tooling added. The judgment hours are real scientific work; the argument is that on a platform they get spent on the judgment itself instead of on re-deriving the context that makes judgment possible. If you think my split between mechanical and scientific is wrong for your team, move hours between the buckets and see what survives.
One more scope note, because the model doesn't apply to everyone: if your spreadsheet supports a one-off analysis rather than ongoing monitoring, none of this is aimed at you. The tax accrues specifically because the work repeats every month. A single project's worth of manual handling is just called doing the project, though Datasparks makes that faster and easier too.
Why "cheap" wins meetings anyway
If the math is this lopsided, why does the $25 stack keep winning procurement? Because the two costs live in different systems. Tooling is a purchase that triggers review, comparison, sign-off. Labor absorbed into existing salaries triggers nothing. A $65 platform fee is a decision; $1,500 of invisible monthly effort is just… Tuesday. The stack isn't winning on cost. It's winning on which costs get counted, which is an accounting artifact wearing a frugality costume.
There's a second-order cost I haven't priced, because it's harder to put a number on honestly: what the scientist didn't do with those 26 hours. Interpretation, field time, the report that would have caught the trend earlier. If anything, the figures above are conservative, and I'd rather be conservative than clever.
Run your own bar
The single next step: reconstruct last month. List the data-handling tasks your team actually did, estimate the hours, multiply by your loaded rate, add your tooling invoices. That's your bar on the chart - your real number, not mine, and the first time your shadow payroll will ever have appeared in writing. If it comes out small, you have a well-run stack and my congratulations. If it comes out looking like the chart above, the comparison you want next is Datasparks vs the DIY stack, which takes this arithmetic and adds the part money can't fix: what those default pipelines quietly do to your gaps.