
Cloud storage is nearly free. Getting your data back out is where you pay the price; and if your organization's job is serving data to people, the getting-out part is your whole business. This post is about a pricing asymmetry most teams discover only after they've built on top of it, and about how to see it coming with one chart and five minutes of arithmetic.
The room is cheap; the minibar is the business model
Here's the shape of it. Every major cloud prices data movement asymmetrically: data flowing in is free, and data flowing out to the internet is metered. On AWS, the first 100 GB out each month costs nothing, and after that you pay $0.09 per gigabyte in the first tier, easing down toward $0.05 at very large volumes. Storage itself keeps getting cheaper; the exit keeps its price.
I think of it as hotel pricing. The room rate is what you compared when you booked; it's competitive, it's public, it's the number on the invoice you budgeted from. The minibar is where the margin lives. Nobody books a hotel for the minibar, and nobody adopts a cloud for the egress line, but if your usage pattern happens to be "eat from the minibar all day, every day," the room rate was never the price that mattered.
The asymmetry isn't an accident, and I don't even think it's sinister. Free ingress means there's no toll on the road into the ecosystem; metered egress means the road out gets more expensive when more of your operation depends on traveling it. It's rational vendor economics. It just happens to fall hardest on one particular kind of customer.
Which customer? The one serving data
Most cloud workloads barely notice egress. An internal app moving modest traffic to a modest user base stays near the free tier forever, and for them this whole post is a non-issue. That's the honest boundary, stated up front.
But look at what an environmental data platform, or any data-serving operation, does all day: ships datasets to browsers, delivers files to partners, feeds dashboards, answers API pulls from clients and agencies. Serving data out isn't overhead on the mission; it is the mission. And that means the metered line scales with exactly the thing you're trying to grow. More subscribers, more shared dashboards, a bigger network, a successful open-data program. Every unit of success opens the minibar again.
That's what makes it a trap rather than merely a cost: it's a tax whose base is your own success, invisible at the pilot stage. Pilots live comfortably in the free 100 GB tier and are structural by the time it's material. The pilot project's invoice tells you nothing about the program's.
The crossover
The alternative cost structure is a fixed monthly line: owned or colocated infrastructure behind a business internet connection, where bandwidth is a predictable monthly expense and each additional gigabyte costs essentially nothing. Put that next to cloud egress pricing and there's a clear crossover point.
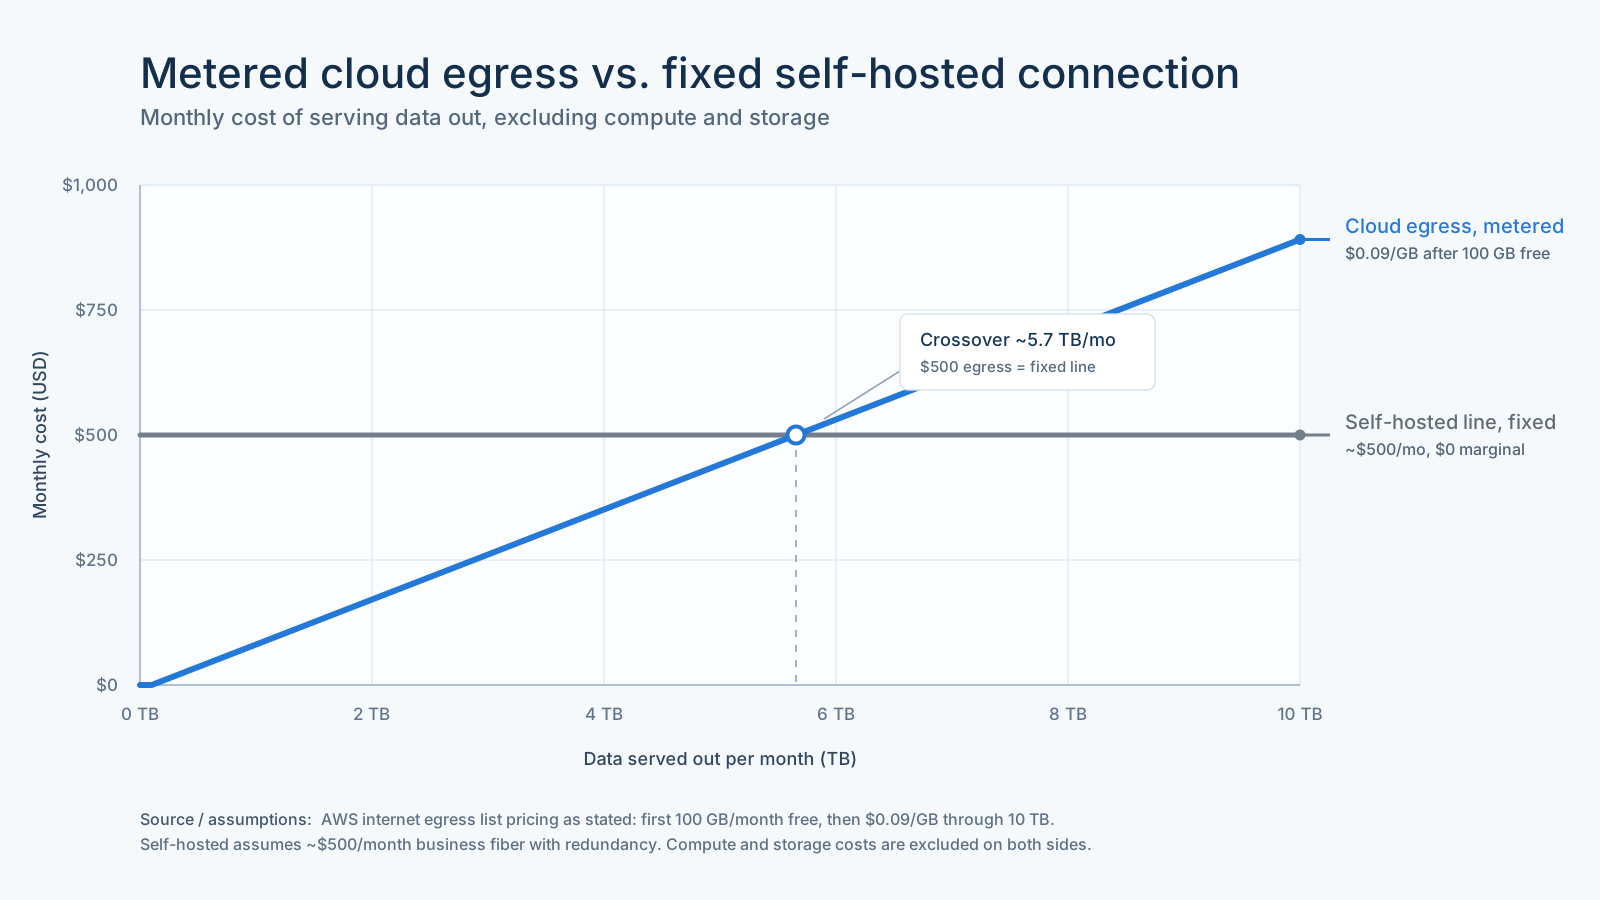
Figure 1. Monthly cost of serving data to users. Cloud pricing uses AWS internet egress list pricing (first 100 GB/month free, then approximately $0.09/GB). The self-hosted line assumes a $500/month business fiber connection with redundancy. Compute and storage costs are excluded for both.
The crossover occurs at roughly 5.7 TB per month. At $0.09 per GB, serving that much data costs about $500 in egress charges alone, equal to the entire monthly cost of the fixed connection in this example.
The exact crossover depends on your own internet costs. We've assumed approximately $500 per month for a redundant business internet connection, but you should substitute your own numbers. The important observation isn't the precise crossover point, it's the shape of the curves. One grows with every additional terabyte served; the other remains essentially flat.
Estimating your own exposure
You can size this for your own program with grade-school arithmetic, and it's worth doing at the ambitious end of your plans rather than the current state. Count the flows that leave the cloud: how many users, times how much data lands in their browser per session, times sessions per month. How many partner or agency pulls, times the dataset size. How many automated dashboard refreshes, times their payload. Sum it, subtract 100 GB, multiply by $0.09.
A worked example, to show the mechanics rather than predict your bill: two hundred users pulling 100 MB of data twenty times a month is 400 GB; five partners pulling a 50 GB dataset four times a month adds 1 TB; and you're at 1.4 TB — about $117 a month, real but survivable. Now let the program succeed: five times the users, twice the partners, and the same arithmetic lands at 4 TB and about $350 a month, drifting toward the crossover — still before compute or storage. The point isn't my toy numbers; it's that the growth terms are exactly your success metrics. Run it with yours.
What we did about it, and what you can do
I'll disclose our position rather than pretend to neutrality: Datasparks serves interactive analytics by shipping each user's browser a working database and keeping it synced. Which is a workload that lives on the wrong side of the egress meter almost by definition. We ran this exact arithmetic and chose to own our serving infrastructure on a fixed line, and that choice is part of why our meter doesn't include a data-transfer line at all: there's no per-gigabyte cloud bill underneath us to pass through. The longer build-vs-buy version of that story is in the rolling-your-own post.
But the takeaway I actually want to leave is vendor-neutral, because the trap catches builders of every stripe. If you're architecting anything whose success is measured in data served (a platform, an open-data portal, a research repository) do this before you commit: estimate your serving volume at the scale you're hoping for, not the scale you're starting at, and multiply by nine cents. If the number makes you wince, the time to notice was now, while the architecture is still cheap to change. The room rate is real. Just walk past the minibar and read the card on top of it first.