Are you tired of having tons of data but struggling to actually compare it? You’ve invested in sensors. Lab testing. Field collection. Satellite feeds. APIs. Mobile monitoring sites. SD cards pulled from remote equipment. And yet when it’s time to analyze everything together, you hit the same wall: How do you compare data measured at different time-intervals? How do you align satellite imagery with mobile site measurements? How do you make apples-to-apples comparisons when every system speaks a different “time language”? The truth is: more data doesn’t automatically mean better decisions. Connected, comparable data does. That’s one of the reasons Datasparks was built.
The Problem: Data Everywhere. Alignment Nowhere.
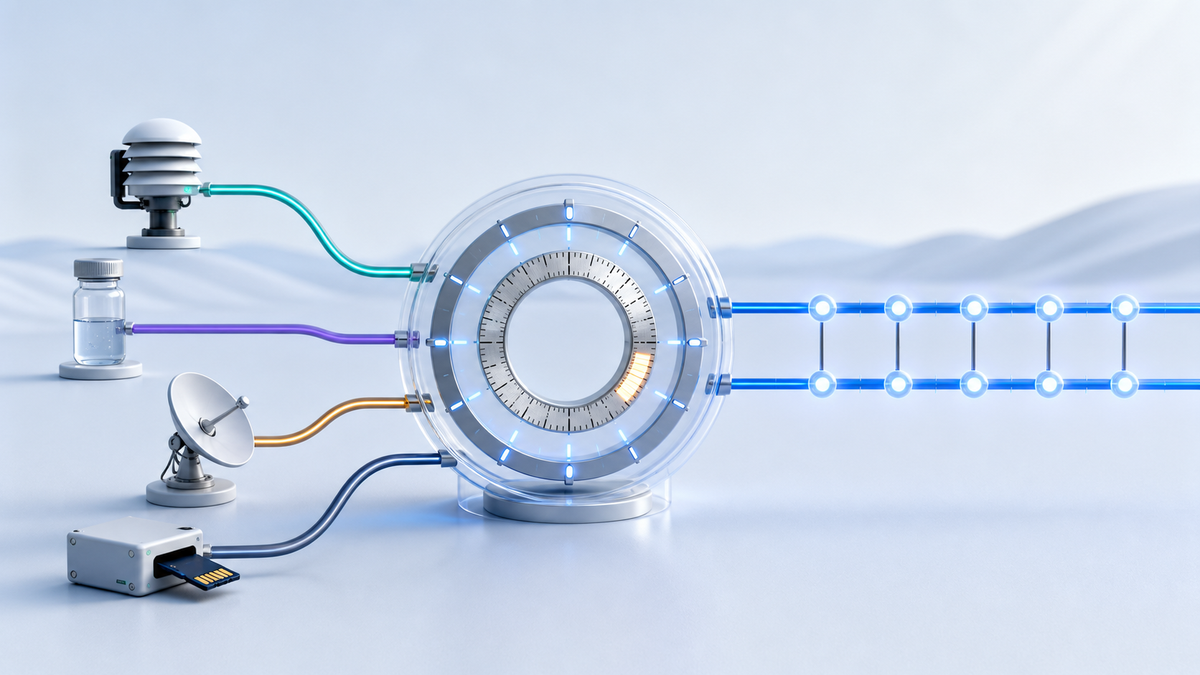
Environmental and operational teams today manage data from everywhere: SD cards from field equipment, lab result files, API streams and pulls, mobile monitoring sites, and satellite datasets. Each source has its own: File format structure, Sampling frequency, and timestamp logic. When those differences aren’t reconciled, you don’t get insight, you get friction. And friction slows decisions. Datasparks allows you to ingest data from virtually any source or format into one centralized environment. Instead of forcing your data to live in silos, Datasparks brings it together structured, organized, and ready to work.
The Real Challenge: Time
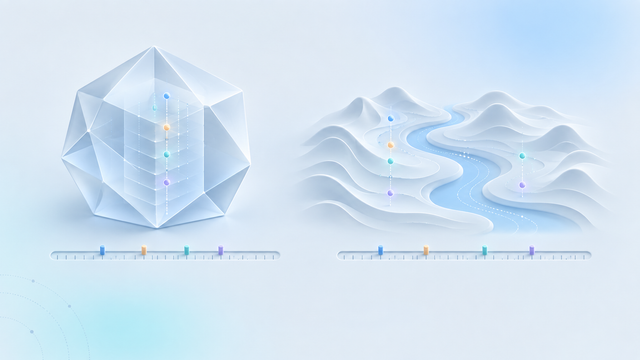
If you’ve ever worked with environmental data, you know that time doesn’t often line up neatly. One source logs every minute. Another every five minutes. Another once per hour. Another once per week. Trying to compare them without fixing timestamps feels like comparing apples to oranges. That’s where time harmonization changes everything.
Time Harmonization: Apples-to-Apples Comparison
With Datasparks, you can synchronize timestamps across datasets so that they align on your terms using our feature Time Harmonization. Instead of wrestling with mismatched clocks, you choose how the data should behave: Up-sample to fill in more data points, down-sample to match a slower frequency, take the mean or mode over a defined window, apply linear interpolation for smoother transitions, use circular mean for directional data like wind. For example, say your lab collects samples every 5 minutes but your real-time sensor streams data every 1 minute. Do you: Average the 5 sensor readings to match the lab timestamp? Assign the same lab result across all 5 minutes? Interpolate between lab values? With Datasparks, the choice is yours. The result? Cleaner datasets. Clearer comparisons. Stronger conclusions. You stop fighting formatting issues and start seeing patterns.
Alignment Isn’t Just About Time — It’s About Units
Time isn’t the only thing that creates apples-to-oranges comparisons. What happens when: One dataset reports in ppm and another in mg/m³? Temperature is recorded in Celsius in one system and Fahrenheit in another? Flow rates come in as gallons per minute in one file and liters per second in another? Even if timestamps align perfectly, mismatched units can quietly distort analysis. Datasparks allows you to harmonize units across datasets, standardizing measurements so comparisons are mathematically and scientifically sound.
Derived Metrics: Turning Raw Data into Meaning
Once your data is both time and unit aligned, Datasparks lets you build derived metrics, customized calculations that combine multiple inputs into actionable indicators. Instead of manually stitching together spreadsheets, you can combine lab and sensor data, normalize across sites, calculate performance thresholds, generate comparative indices. Now you’re working with context and the full-picture, not just raw numbers. This leaves you with the ability to compare datasets from almost any source in a calculated and confident way.
Why This Matters,
When data is fragmented comparisons are slow, assumptions creep in, confidence drops, decisions stall When data is unified and harmonized trends become visible, variability makes sense, insights accelerate, decisions strengthen. Better inputs drive better analysis. Better analysis drives better decisions. So instead of asking: “How do we even compare this?” You start asking: “What does this tell us?” And that’s when insight happens.