
This autumn we went back to first principles on the Datasparks connector wizard, which is the part of our product that defines how we turn a customer's file or data feed into readings in the data lake. Before changing anything, I wanted to know how other products had divided that work. Spreadsheet tools, log platforms, open-source cleaning tools, embedded importers and accounting software have each solved some version of these problems, and each made different choices about how to address them, or if they should own the problem at all.
The study produced a framework that I find useful well beyond our own product. Converting a raw, likely messy input into structured records is five separate problems: finding the table, reading the cells, reshaping the data, matching to what we already know, and handling the next file or message. How a product chooses to address those five problems depends on the job the product was built for. Different products divide the same work along different lines, and several of the questions that they raise are better answered by other parts of a data platform than by its import step. Choosing where to store the definitions and instructions for the ingestion process is a key part of making the importer work well.
What are the five problems?
A reading, in Datasparks terms, is one measured value together with its time, the metric that it measures, the source that produced or delivered the data, and the sampling node where it was measured. A typical environmental logger export shows four, with Source implied. It may include two lines of station notes, then a header row, then a timestamp column written month first, a Site column, and one column for each measurement. Each of the five problems requires a decision about how to handle a file like that.
Finding the table is locating where the data actually starts and stops. That means skipping title rows and notes, choosing the right sheet in a workbook, or finding the array of records inside a nested JSON payload. If this fails, the header is read from the wrong row and every column name after it is wrong, readings end up being tied to the wrong site or metric and you store a 'alert_status' of 103 degrees C.
Reading the cells means deciding what each value is: a timestamp, a number, a code, free text, or a JSON structure of its own. Errors here are hard to catch because a wrongly interpreted reading usually still looks valid. A date read in the wrong order is still a valid date, as 03/04 is a perfectly good day in either March or April. A well-known example of this failure comes from genomics, where spreadsheet software silently converted gene symbols such as SEPT2 into dates. A 2016 study found the error in 704 of 3,597 published papers that shipped gene lists as Excel files, about one in five. In 2020 the human gene naming guidelines renamed the affected symbols, so SEPT1 is now SEPTIN1.
Reshaping is changing the layout of a table without changing its content. A logger export is usually wide-by-metric, with one column per measurement, while a columnar time-series store wants one row per reading. When reshaping fails, a value lands under the wrong metric, and nothing about the number itself reveals the mistake.
Matching to what you know means connecting the names in the file to things or records that already exist in your system. "NY-01", "NY 01" and "Station NY01" may be one monitoring location or three. A wrong match merges two places into one, so their readings mix. A missed match creates a duplicate location, and one place's reading history gets split between two records.
Handling the next file means making the decisions taken on the first delivery get applied to every later delivery of the same data. A sensor firmware update that renames two columns is a common version of this problem. When it fails, people either repeat the work every week or else the software guesses again, guesses differently, and leads to a nice data swamp.
How nine products, and ours, divide the work
We looked at products that solve some version of this problem and rated each one on how they address these five problems, using the vendors' own documentation. "Core" means a first-class, documented capability. "Partial" means the capability exists but is limited, manual or indirect. A dash means the problem is not part of that product's job, usually for a good reason that I explain below.
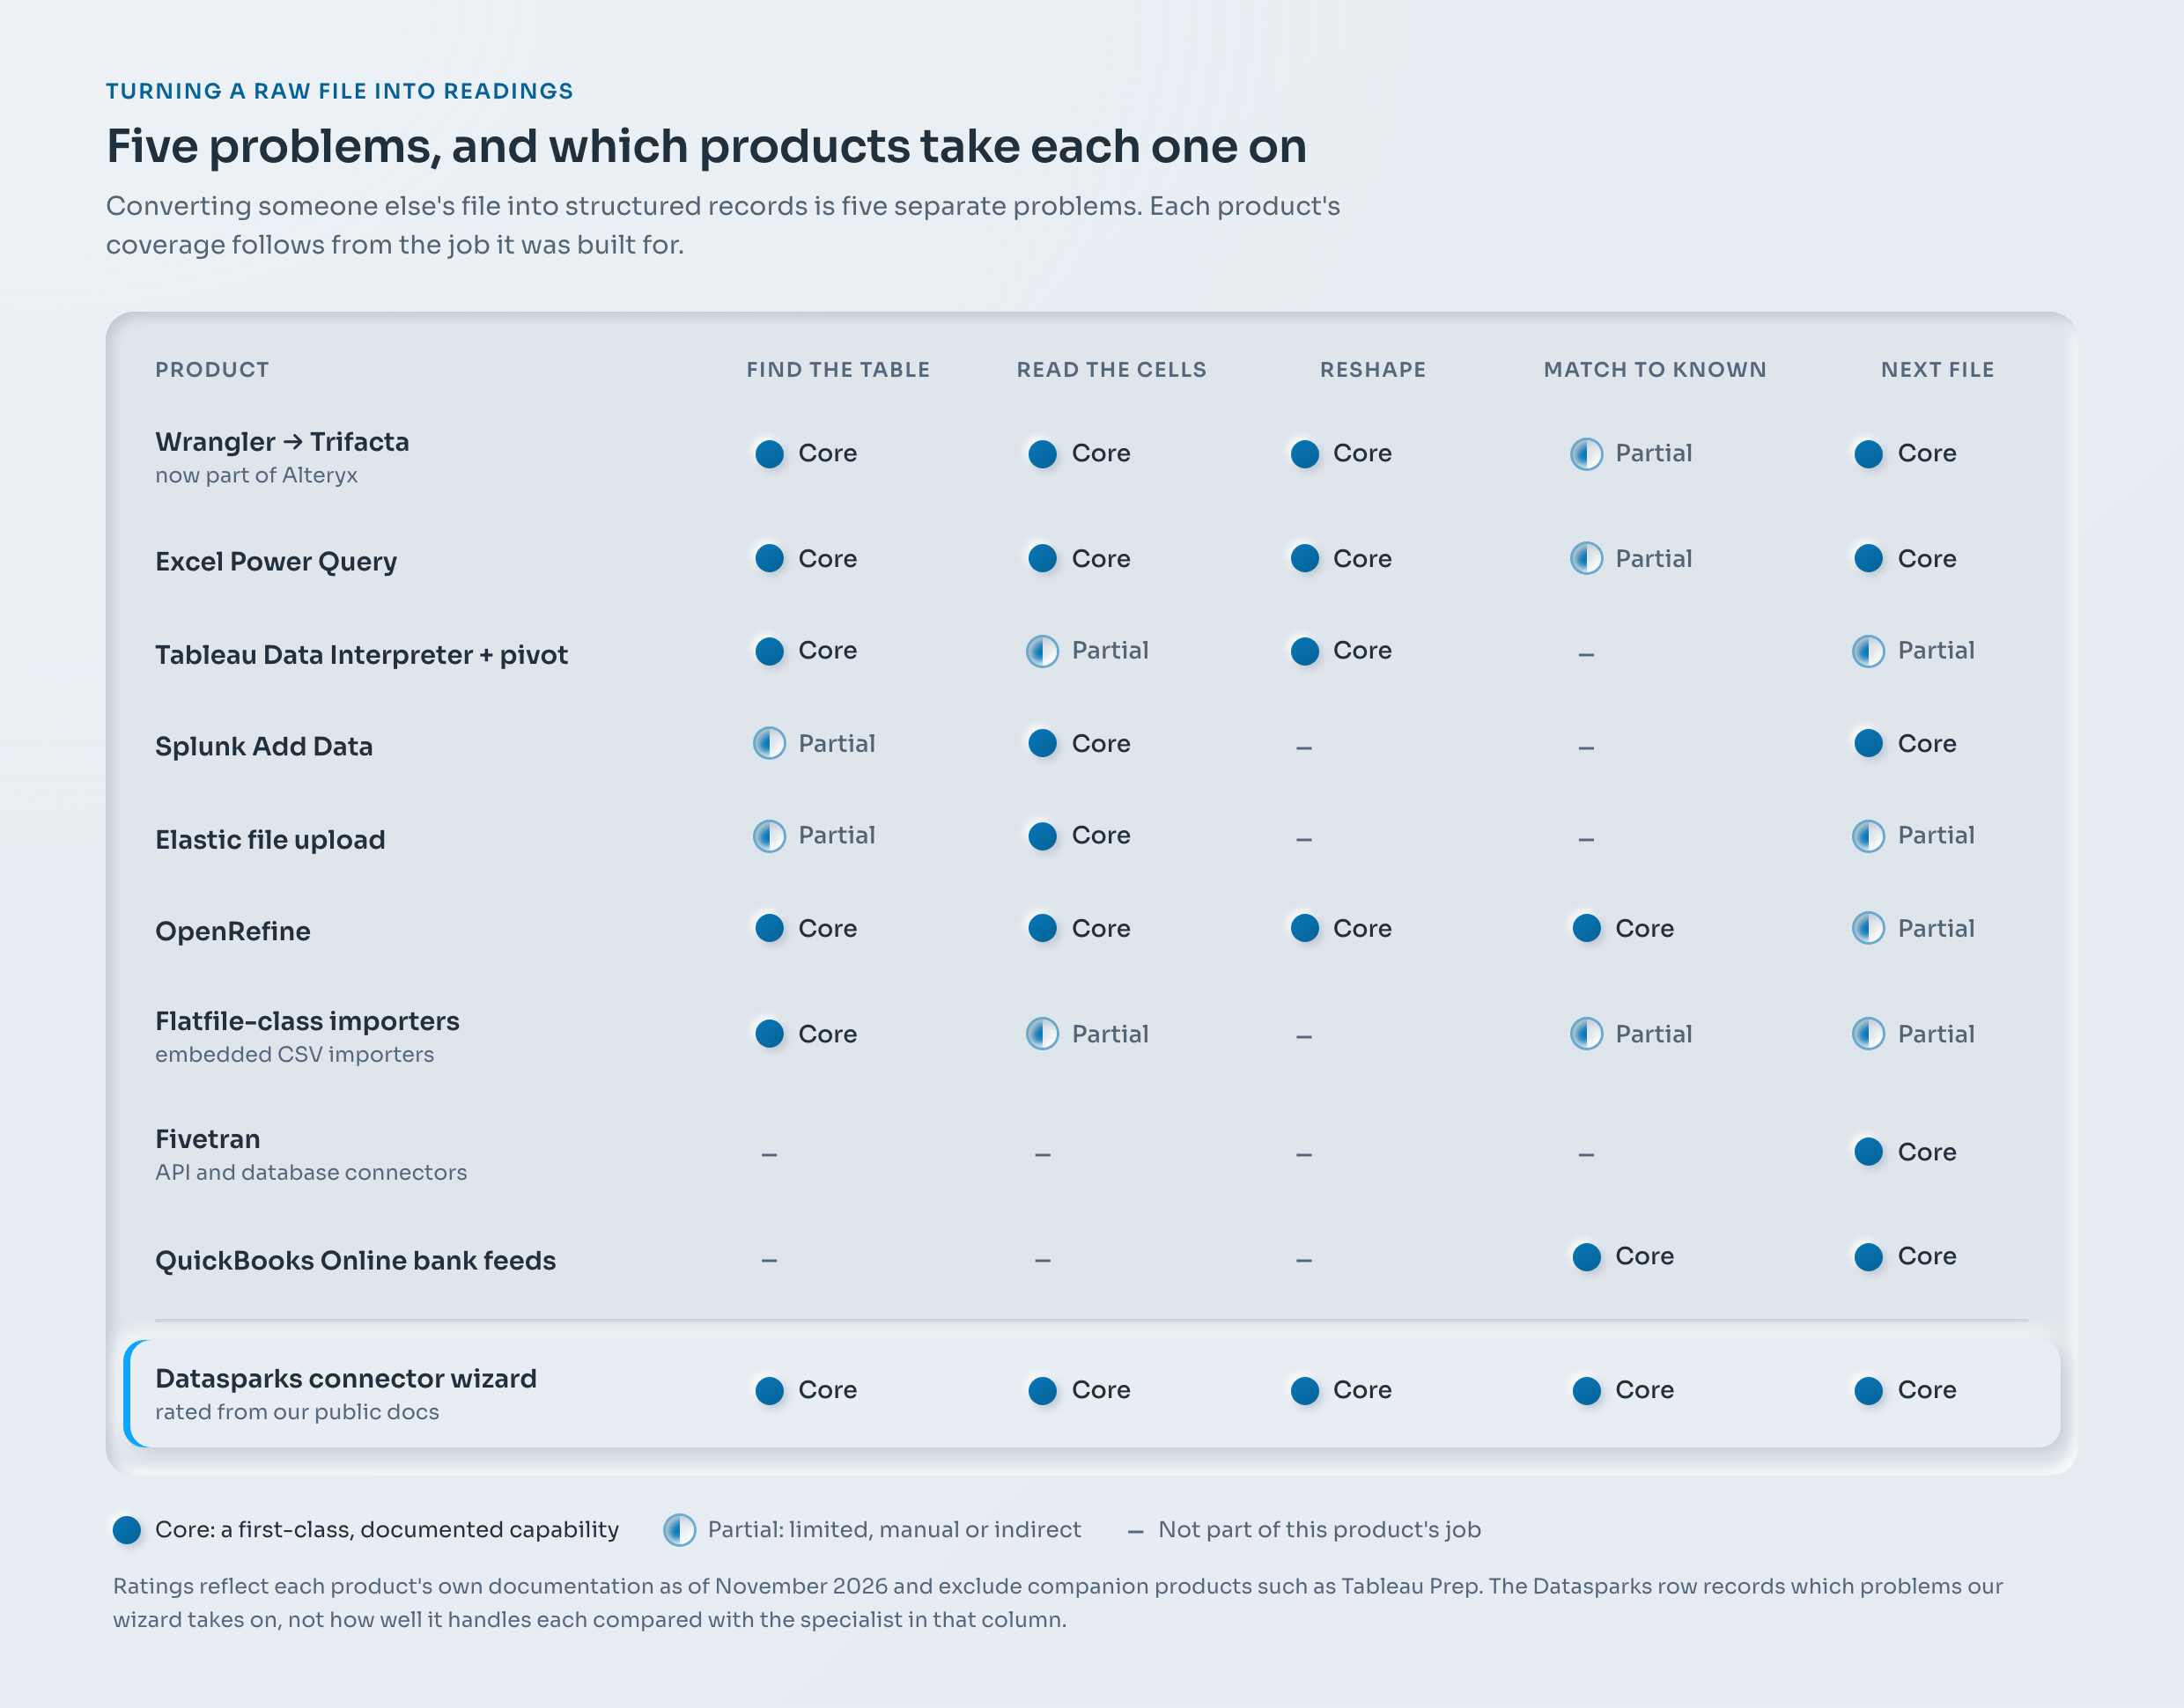
The ratings reflect each product's documented capability as of November 2026, and they exclude companion products such as Tableau Prep. The Datasparks row shows which problems our ingestion flow takes on. The dashes mostly follow from each product's purpose, and it's important to think about why each product chose to address, or punt on, the problems they did.
Two products represent the 'recipe' tradition. Wrangler was a research prototype from Stanford and Berkeley, published in 2011, that became the commercial product Trifacta, which is now part of Alteryx. Excel's Power Query was built separately by Microsoft and takes the same approach of creating a recipe. Both let a person transform the data by working on it directly, record every transformation as a step, and show the data after each step. Trifacta can run a saved recipe on new files automatically, and Power Query reruns its whole query on refresh. Their lasting contribution is that the transformation becomes a visible artifact that someone can read, edit and rerun. Neither keeps a register of the things your data describes, so matching is limited to lookups and approximate joins against another table.
Tableau's Data Interpreter finds the real table inside a decorated spreadsheet, setting titles, notes and footers aside so that analysis can start, and its pivot turns wide columns into rows. Reading data types is left to Tableau's general data source settings. The interpreter's cleanup is tied to one workbook's connection. Refreshing that connection reapplies it to an updated file, but it isn't saved as a recipe for a different file, which fits a tool whose job ends when the analysis can begin.
Splunk and Elastic come from machine data, where the problem is reading very large volumes of events correctly. Splunk's Add Data screen shows events breaking and timestamps parsing as you adjust the settings, then saves them as a named source type that later data can use. Elastic's file upload detects the delimiter, header row and timestamp format and suggests mappings and an ingest pipeline, and Elastic's own documentation describes it as a tool for initial exploration rather than a repeated production process. Reshaping and matching matter less in this tradition, because each event is stored as the event it was.
OpenRefine is the strongest tool here at matching. Its reconciliation services compare the values in a column against an external register, such as Wikidata, and the user approves each proposed match, one cell at a time or for every cell with the same text. Its import screen lets you choose the sheet, the header rows, the rows to skip and the record path inside a JSON file. Its operation history can be extracted and applied to another dataset by hand, which covers the next file only partly, because someone has to remember to do it.
Embedded importers in the Flatfile class put a guided, forgiving column-mapping and validation screen inside someone else's application. They suggest mappings for a field's allowed values, which the user can override, and they remember mapping choices for the next import into the same schema. Converting unusual date formats is left to the host application's own code, and reshaping falls outside their design, because the job is a single upload into a fixed schema.
Fivetran sits at the far end. Its API and database connectors read sources whose structure is already known, so the first three problems are handled before the user arrives, and matching against a register falls outside what a sync does. What remains for the user is keeping each sync running as the source changes. Fivetran's file connectors do take on some of the first two problems, which is why the row is scoped to the others.
QuickBooks bank feeds show the matching problem most clearly. Bank feeds do no parsing that a user sees. Their work is matching each incoming transaction to records that already exist, with suggestions that the user accepts, and applying bank rules that categorize future downloads the same way. They can do that because a company's books are a register of the payees and accounts that it already has.
What the pattern shows
In the table, "next file" is the problem that the most products address in some form. All nine do something about it. The products that apply saved decisions automatically are the ones built for repeated deliveries, and the ones that do it partly or by hand are built for exploration or a single import. Matching to what you know is the problem that the fewest products treat as core. Only two of the nine do, and a product needs it only when it keeps a register of known things. OpenRefine borrows its register from a reconciliation service. A spreadsheet tool has no register of its own, so the best it can do is join against another table that someone supplies. This gap is why the industry has grown 'semantic' or 'ontology' layers within the data stack.
A measurement platform needs a solution to all five problems. Loggers that we didn't design send files in shapes that we didn't choose. Every reading must attach to a source, a sampling node and a metric that the project already knows about, which is the identity model that I wrote about in why Datasparks defines the target schema. The same logger then sends another file next week. Our wizard and ingestion flow takes on each problem. It asks which sheet and header row to use and where the records sit in a JSON payload, reads timestamp formats and asks which time zone they are in, handles wide and long layouts, and matches names to existing entities or creates new ones. Each confirmed shape becomes a connector version, and later data that matches the live version loads without being mapped again. When the shape of incoming data changes, the platform raises it as a shape change for review instead of guessing. Our ingestion process has limits as well. For example, currently-built timestamp parsing doesn't recognize dotted dates, full month names, or a date and a time in two separate columns, so those files need reformatting first. It also reads each column heading as a single thing, so a heading that encodes both a station and a measurement doesn't get split for you.
Taking on all five problems doesn't make us the best at each. Wrangler and Power Query showed that a person judges a transformation fastest when the data is visible after every step. Splunk's source types showed the value of deciding once how a source is read and then holding that decision, instead of inferring it again on each delivery. The genomics episode above is the clearest argument that an import step should not change a value's type without telling anyone, because the wrong value still looks plausible.
Other traditions draw the lines elsewhere
Our five problems all concern reading a file. Other fields frame the same work along different lines.
The data wrangling literature, including the Trifacta authors' book Principles of Data Wrangling, organizes the work around profiling the data and three kinds of transformation: structuring, enriching and cleaning. Data integration research names schema matching and mapping, and data matching, also called entity resolution, as its core problems. A related line of research on data fusion asks what to do when two sources disagree about the same real-world thing (we store them both so the user can identify where they diverge).
In Airbyte, a sync tool, you choose a sync mode for each stream, which decides whether new records are appended or deduplicated, and for incremental modes you name a cursor field, plus a primary key when deduplicating. Airbyte and Fivetran both have settings for how changes to the source's schema are handled. Observability platforms such as Prometheus classify every metric by type, for example a counter that only goes up or a gauge that moves both ways, and their documentation treats cardinality, the number of distinct time series, as a cost to keep low from the start. Industrial historians such as AVEVA PI typically attach units and interpolation behavior to each tag.
Read together, these frames add two problems to our five. The first is understanding the value: what kind of quantity it is, what its unit is, what "no value" looks like, and what range is plausible. The second is fitting with what's already there: whether a delivery overlaps data already loaded, and how many series and how much volume it creates. Both have well-known failures. NASA lost the Mars Climate Orbiter in 1999 because ground software produced impulse values in pound-force seconds where newton-seconds were specified, and the trajectory model consumed them unconverted. Closer to our own work, wind direction simple-averaged as a plain number turns readings of 359° and 1° into 180°, which points the opposite way. A cumulative energy meter averaged instead of differenced produces a curve that misstates the energy used.
Where should each answer be stored?
My first instinct was to add these "what is the value" and "what to do with what's already there" questions to the connector. On reflection most of them don't belong there, because their answers are stored somewhere else.
An environmental lab's sample receiving desk records what arrived, which project and location it belongs to, and the chain of custody. It doesn't decide the analytical method or the reporting limits. Those belong to the lab's methods, which apply to every sample no matter which courier delivered it. If the receiving desk also wrote down a method on each intake form, the lab would soon have two records of how a sample should be analyzed, and they would eventually disagree.
Datasparks has three such places. The connector definition records how to read one source: its layout, its timestamps, and how its names match things in the project. The data pipeline and quality rule definitions decide what happens to values whenever data is processed. The metric definition records what a metric is. Sorting the extra questions into those three places settled most of them.
Placing the extra questions
What "no value" looks like is a pipeline concern. Ingestion doesn't fill a missing value, and a harmonized variant bridges only the gaps that are shorter than its fillable time gap. Placeholder codes such as -9999 are handled by quality rules that the project sets up, such as Replace Values, which run whenever the data that they cover is processed. Asking about placeholders in the wizard would create a quality rule in a second place.
Overlapping deliveries are also a pipeline concern. A reading's identity in Datasparks is its project, source, sampling node, metric, start time and end time. It doesn't depend on which file carried the reading. When two exports from the same logger overlap, readings with the same start and end times are recognized as the same readings, so no duplicate is created. If a value has changed between the two exports, the newer upload replaces the stored one. How to handle the overlap needs no question at upload.
Volume and cost are questions about the platform's economics. One of the premises behind Datasparks is that compute and storage are now cheap enough that simply reprocessing data costs less than maintaining delta processing and change-tracking machinery. Change-tracking logic has to handle late, corrected and repeated data correctly in each combination. A full reprocessing run turns all of those cases into the same case.
Behavior and units belong to the metric. In our data model a metric can carry a behavior (continuous, circular, cumulative, rate or categorical), and that behavior seeds the defaults that its harmonized variants start from when they are created. It describes the quantity, so it doesn't change when a different file reports the same metric. Units are the question that I'm least settled on. We deliberately don't require them, because some data is truly unitless, and a required field invites guesses. The useful distinction, which the UCUM unit standard makes by writing a dimensionless unit as "1", is between "this has no unit" and "nobody has said". If we add units, the metric's unit will belong to the metric definition. The unit that a particular source sends, such as Fahrenheit from one logger when the metric is defined in Celsius, would be a connector fact and should probably be handled by creating Derived Metric calculations in Datasparks.
AVEVA PI reaches the same placement from the plant floor. PI is the historian at the center of operations data in many industrial plants, and Datasparks is sometimes compared with it. In PI, units and interpolation are attributes of the PI point itself. Each point's base attributes include engineering units and a step setting, and for numeric points the step setting decides whether values between archived events are interpolated or held until the next one. Both live on the point's definition, and retrieval applies them to the values that the point has archived. PI's Asset Framework then supplies the context that a tag name carries poorly: an asset model in which each piece of equipment is an element, and the element's attributes can reference PI points. The correspondence with our model is close but not exact. A PI point is roughly a Datasparks metric at one sampling node, and the Asset Framework plays the role of a project's assets and sampling nodes in Datasparks. PI repeats its attributes on every point, while we hold behavior once on the metric, where it seeds the defaults of each variant. PI puts behavior where we put it, and units where we would put them, and I take that agreement as some evidence for the placement.
One extra problem does belong in the connector, and we have deliberately left it unsolved so far. Some exports put two things in one heading, such as a station and a measurement, or an industrial tag that encodes plant, unit and instrument in one string. Today the wizard reads a column heading as one thing, such as a metric. Splitting compound headings is about reading the source, so if we add it, the connector is where it will live.
A rule for any import design
The study left me with a test that I now apply before adding any question to an import flow. First ask where the answer will be stored. If it is stored with the connector, the import step should ask it, show the data while it does, and store the answer for every later file ingest. If the answer is stored somewhere else, the import step can show what that other place will do and point to it, but it should not ask.
References
- Kandel, S., Paepcke, A., Hellerstein, J. and Heer, J. (2011). Wrangler: interactive visual specification of data transformation scripts. Proceedings of ACM CHI 2011.
- Rattenbury, T., Hellerstein, J., Heer, J., Kandel, S. and Carreras, C. (2017). Principles of Data Wrangling. O'Reilly Media.
- Doan, A., Halevy, A. and Ives, Z. (2012). Principles of Data Integration. Morgan Kaufmann.
- Bleiholder, J. and Naumann, F. (2009). Data fusion. ACM Computing Surveys 41(1).
- Ziemann, M., Eren, Y. and El-Osta, A. (2016). Gene name errors are widespread in the scientific literature. Genome Biology 17:177.
- Bruford, E. A. et al. (2020). Guidelines for human gene nomenclature. Nature Genetics 52:754–758.
- NASA Mars Climate Orbiter Mishap Investigation Board (1999). Phase I report.
- Regenstrief Institute. The Unified Code for Units of Measure (UCUM).
- Product documentation consulted for the table: Microsoft Power Query (overview, fuzzy merge); Tableau Data Interpreter; Splunk source types; Elastic file upload and text structure finder; OpenRefine reconciliation and import options; Flatfile fields and mapping; OpenRefine operation history; Alteryx parameterized imports; Fivetran file connectors; QuickBooks Online bank rules; Airbyte sync modes; Prometheus metric types and naming; AVEVA PI base class point attributes, step attribute and Asset Framework attributes.